1959 Chevrolet Bel Air and 2009 Chevrolet Malibu Crash Data
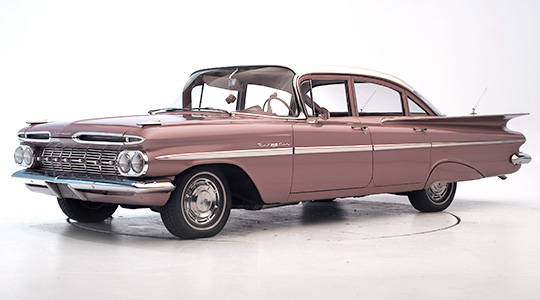
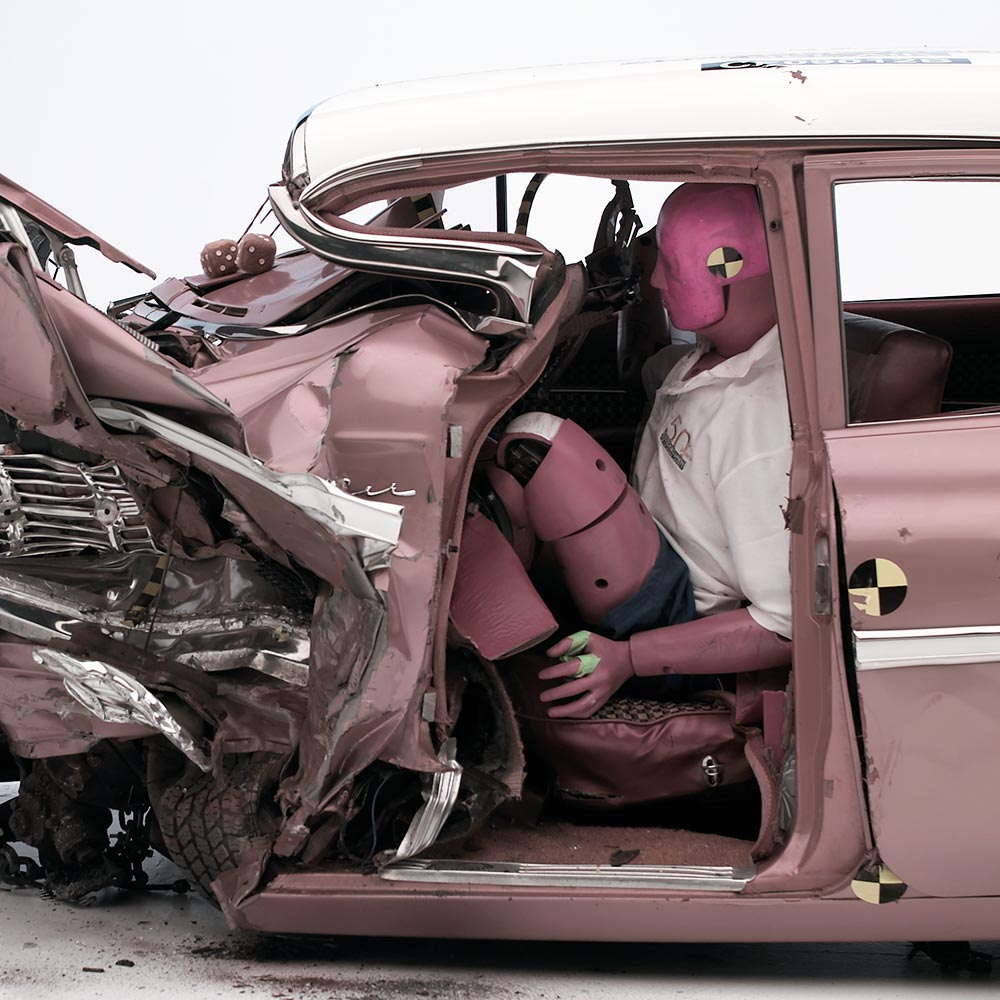
1959 Chevrolet Bel Air
2009 Chevrolet Malibu
40 mph Offset Crash Comparison
Safety Evolution
The comparison clearly demonstrates the dramatic improvements in automotive safety over 50 years. Modern vehicles like the 2009 Malibu incorporate crumple zones, airbags, seat belts, and reinforced occupant compartments that were not available in 1959.
2009 Chevrolet Malibu
Overall
G
Structure/safety cage
G
Head/neck
G
Chest
G
Leg/foot, left
M
Leg/foot, right
G
Restraints/dummy kinematics
G
1959 Chevrolet Bel Air
Overall
P
Structure/safety cage
P
Head/neck
P
Chest
P
Leg/foot, left
P
Leg/foot, right
P
Restraints/dummy kinematics
P
Crashworthiness ratings
G
Good
A
Acceptable
M
Marginal
P
Poor
Intrusion and Driver Injury Measurements
1959 Chevrolet Bel Air
Measures of Driver-side occupant compartment intrusion
| Measurement Point | Location | Intrusion (cm) |
|---|---|---|
| Footwell | Footrest | 62 |
| Left | 55 | |
| Center | 48 | |
| Right | 31 | |
| Brake pedal | 46 | |
| Instrument panel rearward | Left | 32 |
| Right | 27 | |
| Steering column movement | Upward | 23 |
| Rearward | 31 | |
| A-pillar rearward | 26 |
Driver injury measures
| Body Region | Measurement | Value |
|---|---|---|
| Head | HIC-15 | 461 |
| Peak gs at hard contact | 236 | |
| Neck | Tension (kN) | 3.5 |
| Extension bending movemen(Nm) | 125 | |
| Maximum Nij | 1.31 | |
| Chest | Acceleration (3ms clip) (g) | 85 |
| Maximum compression (mm) | 73 | |
| Viscous criteria (m/s) | 1.6 | |
| Sternum deflection rate (m/s) | 3.6 | |
| Legs | Left femur force (kN) | 10.9 |
| Right femur force (kN) | 6.6 | |
| Left knee displacement (mm) | 0 | |
| Right knee displacement (mm) | 6 | |
| Left maximum tibia index | 2.11 | |
| Right maximum tibia index | 1.96 | |
| Left tibia axial force (kN) | 16.9 | |
| Right tibia axial force (kN) | 7.3 | |
| Foot | Left acceleration (g) | 462 |
| Right acceleration (g) | 143 |
2009 Chevrolet Malibu
Measures of Driver-side occupant compartment intrusion
| Measurement Point | Location | Intrusion (cm) |
|---|---|---|
| Footwell | Footrest | 7 |
| Left | 10 | |
| Center | 5 | |
| Right | 3 | |
| Brake pedal | 3 | |
| Instrument panel rearward | Left | 3 |
| Right | 2 | |
| Steering column movement | Upward | -2 |
| Rearward | 2 | |
| A-pillar rearward | 2 |
Driver injury measures
| Body Region | Measurement | Value |
|---|---|---|
| Head | HIC-15 | 215 |
| Peak gs at hard contact | No contact | |
| Neck | Tension (kN) | 1.4 |
| Extension bending movemen(Nm) | 20 | |
| Maximum Nij | 0.30 | |
| Chest | Acceleration (3ms clip) (g) | 41 |
| Maximum compression (mm) | 33 | |
| Viscous criteria (m/s) | 0.2 | |
| Sternum deflection rate (m/s) | 1.1 | |
| Legs | Left femur force (kN) | 2.8 |
| Right femur force (kN) | 2.7 | |
| Left knee displacement (mm) | 5 | |
| Right knee displacement (mm) | 1 | |
| Left maximum tibia index | 0.54 | |
| Right maximum tibia index | 0.59 | |
| Left tibia axial force (kN) | 1.5 | |
| Right tibia axial force (kN) | 2.2 | |
| Foot | Left acceleration (g) | 215 |
| Right acceleration (g) | 89 |
Sensor Ratings of Forces Recorded by Test Dummy
1959 Chevrolet Bel Air
This visualization shows the distribution of sensor ratings across different body regions during crash testing. Higher percentages indicate greater force and potential injury risk.
2009 Chevrolet Malibu
This visualization shows the distribution of sensor ratings across different body regions during crash testing. Note the significantly lower values compared to the 1959 vehicle.
For more information on this crash test go to IIHS's 50th anniversary.